Price is what you pay and value is what you get. This is one of the most well-known lines about investing. Warren Buffett is usually credited as the originator*. And at its core, it boils down to evaluating a stock’s price and valuation, and then understanding how that differs from the stock’s value.
*He uses it and credits his mentor, Benjamin Graham, in his 2008 letter.
Like a lot of sayings, ‘price is what you pay…’ means a lot and nothing at the same time. Remembering that there is a difference between what you pay and what something, especially a stock, is worth, is important. But value is often indefinable, even in a field as numbers-based as investing. Value is, ultimately, an opinion. And we know what opinions are worth.
In this post I’ll talk about evaluating a stock’s price and valuation to understand what we’re paying when we buy a stock. We’ll go into the basic numbers as well as the most common measurements. We’ll put it all into context. In my next post, we’ll talk about how to develop a supported opinion on a company’s value.
Measures of a stock’s price
Share price and market capitalization
Share price is the most available sign of price. But if you remember from our post on what to know about stocks before we buy, we can’t learn much from just the share price. We need to also know the number of shares outstanding to come up with the market capitalization, how much the market thinks the company’s stock is worth.
Number of shares outstanding is available on the stock’s quote page – the page on the brokerage account or a website like Yahoo Finance or Seeking Alpha that lists the share price, the recent chart of performance, and a bunch of stats. It’s also available on the company’s most recent 10-q or 10-k reports, i.e. their most recent quarterly or annual report, which you can find on EDGAR. I prefer to use the number I find on their report, but it’s partly the control freak in me.
We evaluated General Mills financials last time, so let’s stick with it as our example. General Mills’ shares closed trading on July 3rd at $77.12. Their 10-K told us they have 585M shares outstanding as of June 14th. Using that number, we get a market capitalization of ($77.12 * 585M) = $45.1B*.
*We’ll round wherever reasonable. All prices will be as of July 3rd close.
Enterprise value
The other good measurement of price is enterprise value. This includes the company’s debt levels, and says how much it would cost to take the entire company over, if it was available at this price.
We saw General Mills had $11.1B in net debt – debt minus cash and cash equivalents – in our last video. Take $45.1B, add $11.1B, and you get an enterprise value of $56.2B.
If a company has net cash, we subtract it from market capitalization to get enterprise value. Such a company’s enterprise value is less than their market cap. Alphabet, Google’s parent, has a market capitalization of $1.53T, and an enterprise value of $1.43T. Said another way, Google has $100B more in cash on their balance sheet than debt.
Share price, market cap, and enterprise value will be the numerator for most valuation measurements. Which to use? If you are taking a per share figure on the bottom, like earnings per share, share price is what to use.
Otherwise, it depends on what you are comparing to, and for which companies – enterprise value makes no sense for financial companies, for example. Technically, if your denominator includes interest costs, you should use market capitalization, and if it comes before you should use enterprise value. But I prefer to factor in debt for non-financial companies, so I lean towards using enterprise value whenever it makes sense.
Measures of a stock’s valuation
The current ‘valuation’ of the company – how much the market thinks it is worth – is based on the price compared to how much money the company’s making. There are a million ways to assess a company’s valuation, but I’ll start with three basic ones.
Price to earnings or P/E Ratio
Price to earnings is the most common. Divide the share price by the earnings per share and you get the multiple you are paying for earnings.
General Mills earned $4.31/share last year. At a $77.12 share price, it has a PE multiple of 17.9.
We can look at PE in different periods: the next twelve months, for example, based on either the company’s guidance or analyst estimates (analyst estimates is what brokerage accounts and websites will use). This gives us the forward PE multiple, vs. the trailing PE multiple above. I see an estimate of $4.5 for GIS’s next year earnings. The forward PE multiple*, then, is 17.1
* Analyst estimates are often non-GAAP and include adjustments, whereas the earnings on a company’s reports are GAAP. We’ll explain this later, but it is worth noting.
Price to free cash flow
Price to free cash flow is another good valuation measurement. I like free cash flow as it shows me how much actual money is left over for shareholders. Since a company usually doesn’t provide a per share number, you can divide market capitalization by free cash flow. For General Mills:
$45.1B / $2.089B = 21.6.
Price to sales or enterprise value to sales
Lastly for now, there’s a measurement of either price to sales or enterprise value to sales. This is most useful for companies that are not yet profitable. They are often faster growing, and we can start to envision what margins they would have in the future.
This is less relevant for GIS, but if we did this with enterprise value, we would get $56.2B / $20.1B = 2.8x sales.
All of these have their place. We’ll stick with price to earnings for now as the most classic multiple, because we have a couple more things to spell out.
Putting PE in context
First, what does it mean that GIS’s earnings multiple is around 17 or 18? Is that expensive or cheap?
Comparing to peers
You can start by comparing it to peers to see whether GIS gets more or less credit.
| Company | PE (trailing) | PE (forward) |
| General Mills (GIS) | 17.9 | 17.1 |
| Kellogg (K) | 28.3 | 16.7 |
| Hershey’s (HSY) | 30.5 | 26.44 |
| Kraft Heinz (KHC) | 18.3 | 12.3 |
GIS does not appear to be wildly off its peer valuations.
Comparing to the market
You can also compare a company’s PE to the S&P 500, which gives you a decent market benchmark. The tricky part is finding a good estimate of this number. I googled and found the WSJ’s page, which has the S&P 500 at a 19.6x trailing multiple and a 19.8x forward multiple, suggesting earnings will decline. Other sources have the S&P 500 multiple as higher.
It’s not surprising that GIS’s multiple in any case, is less than the market’s, given it is slower growing.
Comparing to the company’s growth
Another good way to put it in context is using the PEG ratio, or the Price to earnings growth ratio. This takes our PE multiple of ~17 and divides by General Mills’s expected earnings growth rate. Analysts current expect GIS to grow earnings by about 5.3% over the next three years compared to 2023. 17.9 divided by 5.3 gets us a PEG of 3.4.
PEG is a way to factor in how fast a company is growing. Peter Lynch was a big fan of it, and used to say a company should be trading around a 1 PEG. As stocks have gotten more expensive since Lynch wrote his books, we can assume PEGs have gone up.
Comparing to past multiples
A last thing we can do is look at what GIS’s past PE multiple has been. Here, you probably need a financial website to help. Here’s Seeking Alpha’s chart:
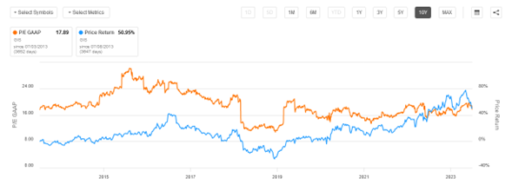
The current PE is on the lower side, but close to GIS’s average, especially since 2019. I included price return so you can get an idea of how much of this ratio was driven by the stock moving and how much by earnings.
What’s missing from the equation
After evaluating a stock’s price and valuation, we can say some things. We can now say whether GIS is cheap compared to its peers – not very. We can say whether it’s cheap compared to the market – yes – or to its historic multiples – maybe a little. We can also say whether it’s cheap compared to its growth – probably not.
This doesn’t tell us whether this is worth buying. A basic illustration.
| Company | PE (trailing) | PE (forward) | PEG |
| Alphabet | 26.5* | 22.6 | 1.6 |
| GIS | 17.9 | 17.1 | 3.4 |
*Using non-GAAP numbers for Alphabet, since that’s what analyst estimates are.
Alphabet is much more ‘expensive’ on an earnings basis. But everyone in the market can see that. Why would that be the case? We can see Alphabet is expected to grow faster. We can also think about the company’s prospects for the future, and why Alphabet’s would be deemed to be worth more – it has a stronger position, it has higher margins, it has more opportunity to grow or take over new fields.
Price? Understood. Next? Value
Price is a fact of the market. We’ve looked at a few ways for evaluating a stock’s price and its valuation and understand what that means. The next step is to combine it all – our understanding of the business’s model, of its financials and how it is doing, and of its price – to make an argument for the company’s value.
2 responses to “How to Evaluate a Stock: Understanding Price and Valuation”
[…] you understand the current price and valuation, and think it’s […]
[…] you want when you are considering buying a stock. Its financials, its business model, its price and valuation, its prospects, and how it stacks up to competitors or the market, among other things. Now let’s […]