We’re looking at a stock to consider for our portfolio. We understand the basics of their business. The next question is how well are they doing? And while a company will be happy to tell you how they’re doing, the best place to look is in the numbers. It’s time to buckle up, because we’re going to evaluate a stock’s financials.
It’s time to buckle up, because we’re going to evaluate a stock’s financials. To do that, we need to dive into the financial statements. Not into every detail. But deep enough to understand whether the business is growing, whether it’s making money, whether it’s gaining more of an advantage, whether it is built to last, and whether it takes care of shareholders. We’re going to do a little math, but not complicated math.
To do all this, let’s use a nice simple company: General Mills (GIS).
Introducing General Mills
General Mills is a food company. To learn about them, we’re going to read their 10-K statement, which is an annual filing public U.S. based companies are required to file. You can find it on Edgar, which is not an homage to legendary American writers or designated hitters, but just the U.S. government’s website that hosts all company filings for free.
Learn more about investing – sign up to our newsletter
General Mills sells food. In the following categories:
- snacks, including grain, fruit and savory snacks, nutrition bars, and frozen hot snacks;
- ready-to-eat cereal;
- convenient meals, including meal kits, ethnic meals, pizza, soup, side dish mixes, frozen breakfast, and frozen entrees;
- wholesome natural pet food;
- refrigerated and frozen dough;
- baking mixes and ingredients;
- yogurt; and
- super-premium ice cream
They have a bevy of brands, including:

I picked General Mills because they just filed their annual report, and because the business is easy to understand. They sell food. They don’t have their own stores – grocery stores and supermarkets and the like are their primary customers. But they market to the end consumer – you and me – so that we buy the products from the stores, leading the stores to stock more.
Initial assumptions about General Mills
I go into this not having followed General Mills at all. But in the understanding their model, we can guess that
- The pandemic and the subsequent inflation may have caused weird effects on their sales and margins, or how much of their sales they keep as profit.
- They are not likely to be a fast-growing company, all things equal.
- They will probably pay a dividend to shareholders as a result
- The company should have low margins – cereal and food are competitive – but still strong profitability
- I would expect the company, as it’s been around for 150 years, to have a solid, stable balance sheet

The 10-K will tell us the company’s results for the last three years, which in their calendar completes at the end of May*. I’ll peek at the 2020 10-K when relevant to capture the pandemic bump effect.
*One of my finance pet peeves is when companies end their fiscal year on something other than December 31st. There’s probably a logic to it, but it’s sort of a daylight savings esque logic – the year is going to be the same either way, folks. When I say a year, I mean the fiscal year in this post.
We will evaluate the stock’s financials with a purpose. Here are some questions to answer that will also address my guesses above:
Evaluating a stock’s financials: Is the company growing?
For this, let’s first look to revenue. Revenue and sales are interchangeable, and this is usually what people mean when they ask whether a company is growing – are its sales increasing from year to year? We find this on the income statement, the first of three main financial statements.
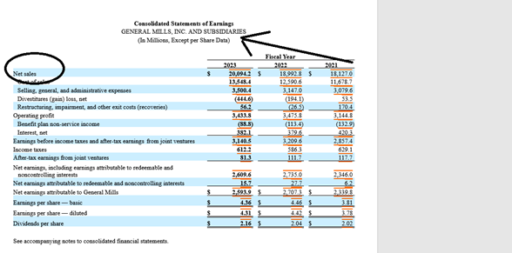
Sales are going up. Dividing the latest year revenue by the prior year revenue and subtracting 1, we get a growth rate of 5.8% in 2023, and 4.8% in 2022.
Glancing at the 2020 10-K, I can find growth rates of 2.8% in 2021 (GIS’s first full year of the pandemic), 4.5% in 2020, and 7.1% in 2019, though they made a big acquisition that year.
A: General Mills is growing, but not very fast.
Evaluating a stock’s financials: Are they becoming more profitable?
Sales growth is important, but if it doesn’t translate to growth in profitability over time, that could be an issue. We mentioned at the top that inflation might be an issue for General Mills. This is where we would see whether that’s a problem.
There are a few types of margins – gross margins, which tells us how much more General Mills is selling their food for than it costs them literally to make it. Then there’s operating margin, which is how much money they make after you count how much it costs them to run their business – marketing, management, sales, and so on. Lastly, there’s net margin, which factors in tax and interest. Those are the big three.
Each matter in different ways. For the question I asked, gross margin and operating margin are most relevant. Gross margin will also tell us how General Mills dealt with inflation – were their growth in sales all eaten up (sorry) by having to pay producers and farmers more?
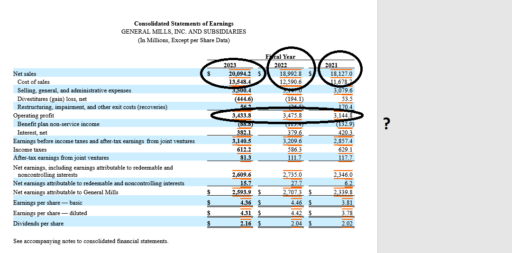
General Mills doesn’t give us a gross profit or gross margin line in their statements, so we have to subtract cost of sales from net sales, and then divide that number by net sales to get a gross margin percentage.
When we do that, we see gross margins have gone from 34.8% in 2020 to 35.6% in 2021 to 32.6% in 2023. Inflation rearing its head in these last two years quite a bit.
We can see that operating profit decreased in 2023 just by observing net sales went up and operating profit went down. Indeed, operating margins rose from 16.75% in 2020 to a peak 18.3% in 2022, before dropping back down to 17.1% in 2023.
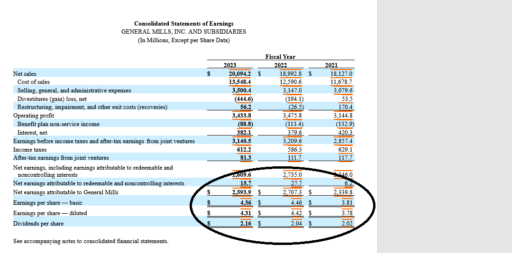
Indeed, General Mills profit on a per share basis and in net earnings looks fine.
We are missing important context – how big is the company, and how much would a new investor be paying for those earnings. I also don’t know typical industry margins to compare General Mills against. But a ~13% margin and 6.5% annual earnings growth since 2020, better than 4.4% annual revenue growth over that time, a) seem like decent numbers for a slow-growing industry stalwart, and b) means the company has operating leverage, a concept we’ll discuss later, but which is a good thing.
A: General Mills’s profitability is stable but not increasing.
Evaluating a stock’s financials: Is the company stable?
Here, we need to turn to the balance sheet and the cash flow statement, the two other main financial statements.
What I want to see here – does the company have a lot of debt? Is there a near to mid-term risk of financial problems?
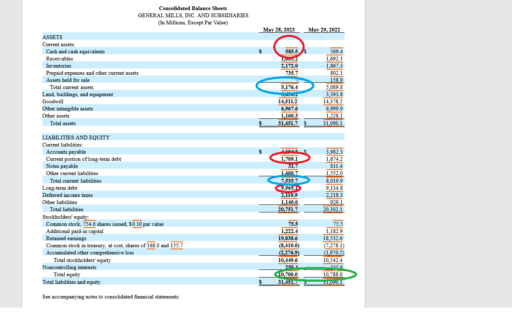
We can compare cash and cash equivalents to long-term debt (including the current portion). This tells us the company has a net debt position of $11B. Which is more than I like but not that big given how big a company General Mills is ($20B in sales, after all, and $2.6B in profit), and how predictable its business is. Long-term debt to equity is about 1, which isn’t bad.
We can look at current assets vs. current liabilities to see how well it would do in a pinch – could it liquidate everything quickly to cover its near-term liabilities? In General Mills case, no – the receivables (money owed from customers), inventories, and cash won’t cover what it owes to suppliers (accounts payable) and its near-term debt. But, GIS will probably be able to manage their supplier relationships and financial situation, so not a major concern.
The last thing I circled is equity. All things equal, we’d like to see a good amount of equity and to see that equity increase, especially since GIS is a profitable company. If all of its profit went to the balance sheet, equity would increase by a like amount. That didn’t play out, as equity decreased. We’ll see why in a moment. But the company still has a healthy equity, or stock, cushion.
The cash flow statement can complete our picture
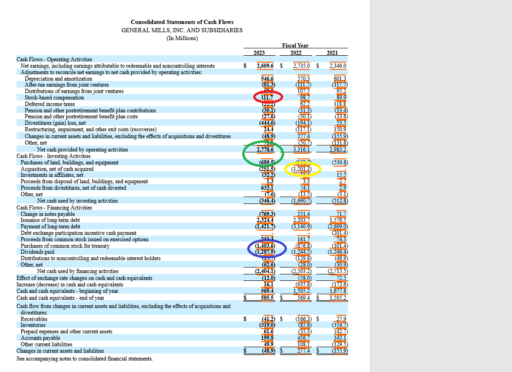
This is maybe the trickiest statement to understand. I want to focus on two main things. First, free cash flow, which is net cash provided by operating activities minus capital expenditures. Companies label capital expenditures in a number of ways. Purchases of property, equipment, and plant is most common. Think of this as investment into the building of the company. In GIS’s case, “Purchases of land, buildings, and equipment” are all investments into General Mills’ business. These expenses will go onto their balance sheet as assets, because General Mills will use them for their business in the future.
Free cash flow is my favorite measure of profitability. It is basically how much money is left for shareholders after the company has invested in its business. In GIS’s case, it’s $2.1B, a little less than its net income, but not too far off.
If it were negative, that would be a potential sign of instability. Cash burn means that the company will have to increase net debt or decrease net cash. Years of cash burn is generally unsustainable.
Then, the blue circle shows how much money they spend on share buybacks and dividends. This explains why equity didn’t go up even with the profit – the money was paid out to shareholders, either to buy them out or to pay them a dividend.
The yellow circle is a big acquisition from last year. We need to watch to see if companies are only growing sales because they acquire smaller companies, and factor that into our analysis. Often, companies will help by reporting an organic growth rate, meaning how much their sales grew not counting acquisitions in the prior year.
A: General Mills is fairly stable
Evaluating a stock’s financials: Is your stake of the company increasing or decreasing?
The last thing I circled on the cash flow statement is share based compensation, which gets added back on the cash flow statement. This is a way for companies to pay employees using options or stock rather than cash. How to account for share based compensation is a little controversial, especially in the tech world. GIS as a boring food company, this isn’t a big number. But worth flagging. If a company is doing this a ton, your piece of the company’s business is shrinking. Likewise, if they are buying back shares, your piece of the company’s business increases.
You can check this very simply by going to the top of the 10K. Somewhere there, you will find this:

That first number is how many shares are outstanding. You use that to calculate the market cap – 585,182,745 * share price ($76.5 when I first wrote this) = $44.76B. But you also can compare that to the prior year’s 10-K to see if the share count went up (dilution) or down (increased ownership). GIS’s share count dropped about 2% in 2023, meaning each share has a slightly bigger piece of the pie.
Share count dilution or reduction isn’t a top priority item as compared to the other questions, except in the extreme cases. But worth looking at.
A: A shareholder’s stake in General Mills increased over the past year.
Evaluating a stock’s financials: Reading between the lines
We’ve learned a lot about General Mills just from reviewing their 2023 numbers: How sales grew, how margins didn’t, how their business remained stable, how shareholders’ ownership increased. What we don’t quite know is why did this all happen?
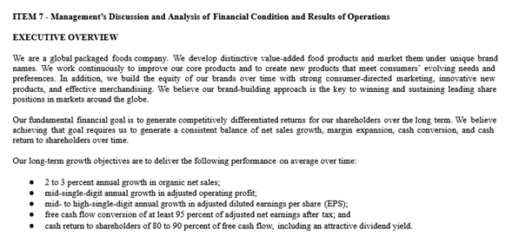
We’ll drill into this when we talk about where to find materials about a company, because there are a number of places you can get ‘color’ on the story. On the 10-K, there’s item #7, which gives us management’s discussion and analysis of the year. This comes with a lot of boilerplate, but is also a good place to get color on the company’s strategy and its explanation for how the year went.
Emerging from the stock’s financials
Ok, that was a lot! But if you can go through this exercise, you’ll understand how a company is performing. If you like what you saw from General Mills here, would it be time to buy?
Subscribe to A Short Investing Guide for more posts on how to invest
Not so fast, my friend. Because we have to remember that price is what you pay, and value is what you get. And we don’t know what the price is yet. Which is where our next video will head – understanding the valuation of a stock.
2 responses to “How to Evaluate a Stock: Breaking Down the Financials”
[…] evaluated General Mills financials last time, so let’s stick with it as our example. General Mills’ shares closed trading on July 3rd at […]
[…] can see something in the financials that suggests good things ahead for the company, and you know that it’s […]